|
This pack includes 6 major categories of animated charts that are most commonly used in business reports and training videos. Check out the instructions below on how to customize and animate these elements in different ways including tempo, speed, and color.
|
| |
How to customize percentage |
|
|
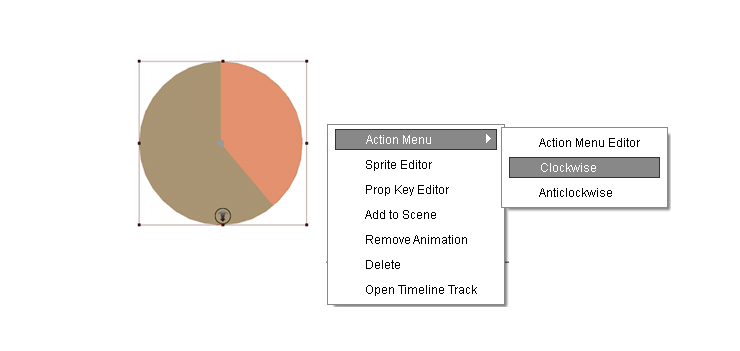
1. Right click the chart and choose a direction from the Action Menu.
|
 |
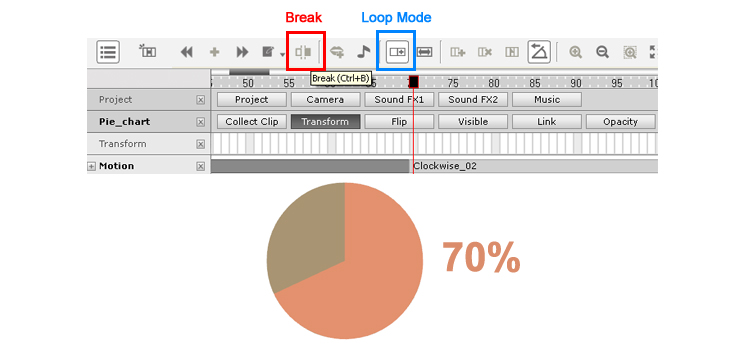
2. The default completion value for all animated charts is 100%. You can easily adjust the completion percentage by right clicking the animation clip at any frame and selecting the Break option to cut the animation there.
For example, if you want the animation to only go up to 70%, simply delete the latter 30% of the clip. If you want to loop the animation, please ensure that you are in loop mode and then drag the edge of the clip to the right.
|
 |
|
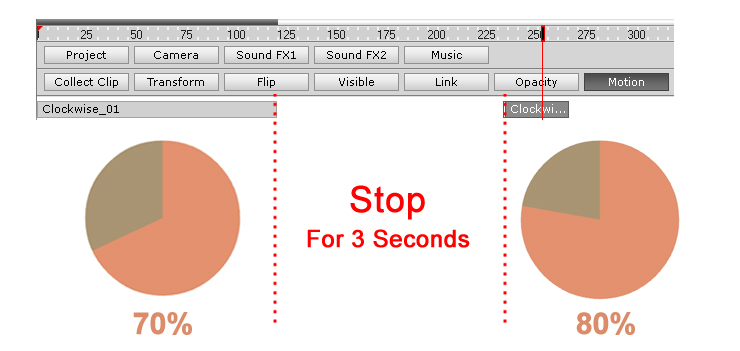
| To pause an animation at a certain point, simply break the clip where you like, and then drag the remaining section of the clip to another point further down the timeline.
|
 |
|
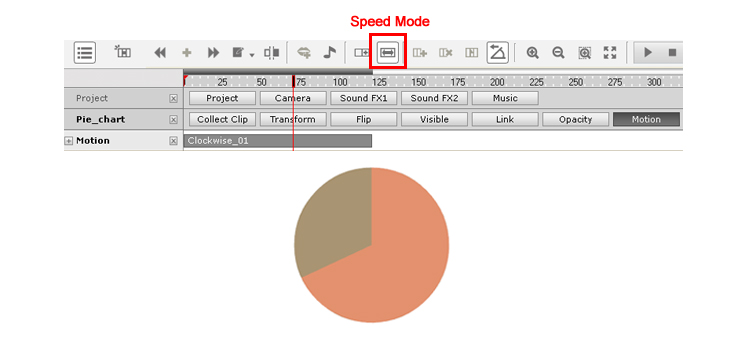
| You can speed up the animation by dragging the clip to the left, which will make it take up a smaller section of the timeline. Conversely, you can slow it down by clicking and dragging to the right. Make sure you are in Speed mode as opposed to Loop mode.
|
 |
|
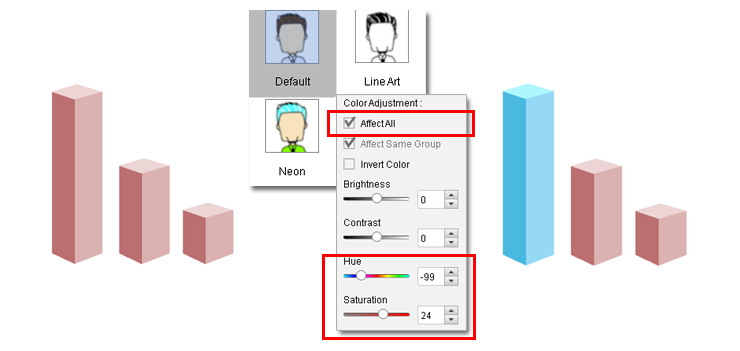
| To change color of a specific object, please select the target object first, go to Render Style settings and choose “Default”. Then check “Affect All” and change colors by adjusting sliders.
|
 |
| |
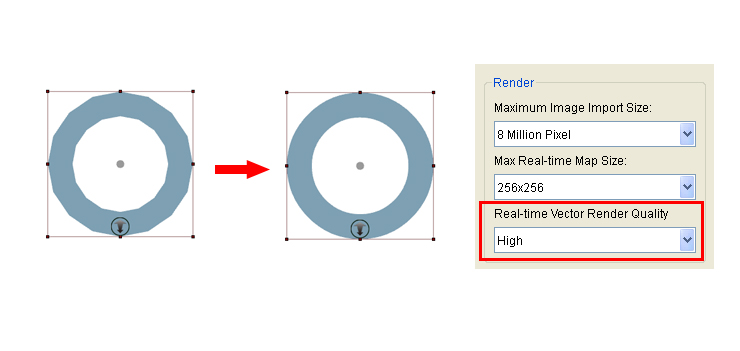
How to refine the edge of objects |
|
| Go to Edit > Preferences and choose “High” in the Real-time Vector Render Quality drop-down menu. You will then be able to notice a finer edge on your prop.
|
 |